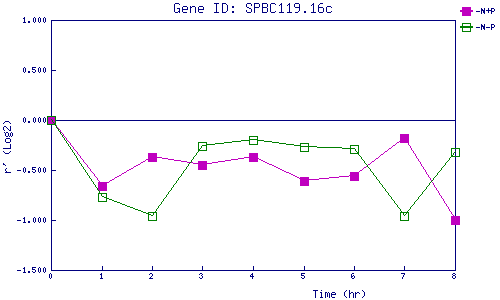
| 0 | 1 | 2 | 3 | 4 | 5 | 6 | 7 | 8 | |
| -N+P | 0.000 | -0.664 | -0.372 | -0.452 | -0.370 | -0.610 | -0.562 | -0.181 | -1.003 |
| -N-P | 0.000 | -0.772 | -0.964 | -0.260 | -0.196 | -0.269 | -0.294 | -0.961 | -0.324 |
|
-N+P: Nitrogen starved in the presence of P-factor -N-P: Nitrogen starved in the absence of P-factor |