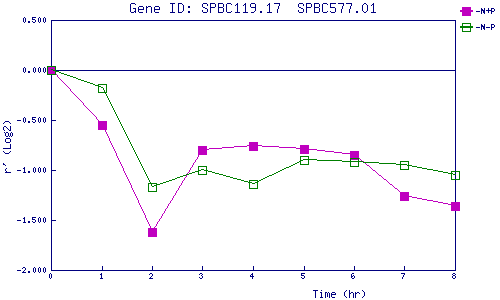
| 0 | 1 | 2 | 3 | 4 | 5 | 6 | 7 | 8 | |
| -N+P | 0.000 | -0.550 | -1.625 | -0.805 | -0.758 | -0.791 | -0.854 | -1.261 | -1.364 |
| -N-P | 0.000 | -0.181 | -1.168 | -1.001 | -1.138 | -0.902 | -0.925 | -0.950 | -1.051 |
|
-N+P: Nitrogen starved in the presence of P-factor -N-P: Nitrogen starved in the absence of P-factor |