| 0 | 1 | 2 | 3 | 4 | 5 | 6 | 7 | 8 | |
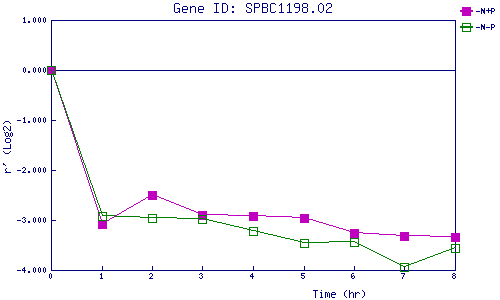
| -N+P | 0.000 | -3.086 | -2.502 | -2.897 | -2.910 | -2.953 | -3.264 | -3.313 | -3.349 |
| -N-P | 0.000 | -2.928 | -2.962 | -2.983 | -3.227 | -3.463 | -3.442 | -3.947 | -3.551 |
|
-N+P: Nitrogen starved in the presence of P-factor -N-P: Nitrogen starved in the absence of P-factor |