| 0 | 1 | 2 | 3 | 4 | 5 | 6 | 7 | 8 | |
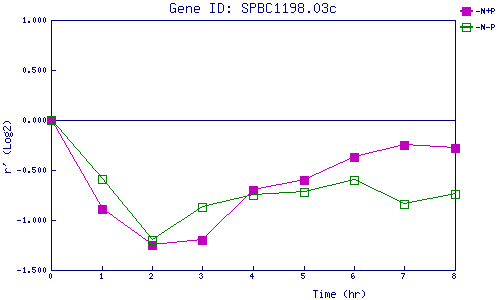
| -N+P | 0.000 | -0.889 | -1.251 | -1.205 | -0.695 | -0.598 | -0.369 | -0.250 | -0.278 |
| -N-P | 0.000 | -0.588 | -1.199 | -0.866 | -0.750 | -0.723 | -0.599 | -0.844 | -0.739 |
|
-N+P: Nitrogen starved in the presence of P-factor -N-P: Nitrogen starved in the absence of P-factor |