zas1
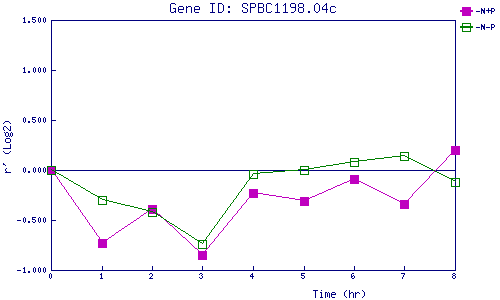
| 0 | 1 | 2 | 3 | 4 | 5 | 6 | 7 | 8 | |
| -N+P | 0.000 | -0.733 | -0.386 | -0.853 | -0.234 | -0.311 | -0.087 | -0.335 | 0.202 |
| -N-P | 0.000 | -0.299 | -0.420 | -0.744 | -0.043 | -0.003 | 0.084 | 0.139 | -0.115 |
|
-N+P: Nitrogen starved in the presence of P-factor -N-P: Nitrogen starved in the absence of P-factor |