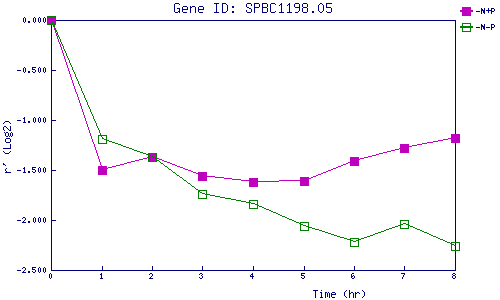
| 0 | 1 | 2 | 3 | 4 | 5 | 6 | 7 | 8 | |
| -N+P | 0.000 | -1.502 | -1.374 | -1.562 | -1.618 | -1.607 | -1.407 | -1.277 | -1.176 |
| -N-P | 0.000 | -1.187 | -1.367 | -1.737 | -1.844 | -2.065 | -2.224 | -2.039 | -2.256 |
|
-N+P: Nitrogen starved in the presence of P-factor -N-P: Nitrogen starved in the absence of P-factor |