ubc16
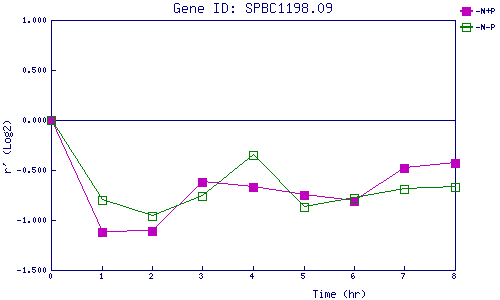
| 0 | 1 | 2 | 3 | 4 | 5 | 6 | 7 | 8 | |
| -N+P | 0.000 | -1.120 | -1.114 | -0.621 | -0.669 | -0.751 | -0.808 | -0.478 | -0.427 |
| -N-P | 0.000 | -0.804 | -0.960 | -0.764 | -0.354 | -0.867 | -0.778 | -0.694 | -0.666 |
|
-N+P: Nitrogen starved in the presence of P-factor -N-P: Nitrogen starved in the absence of P-factor |