pi010
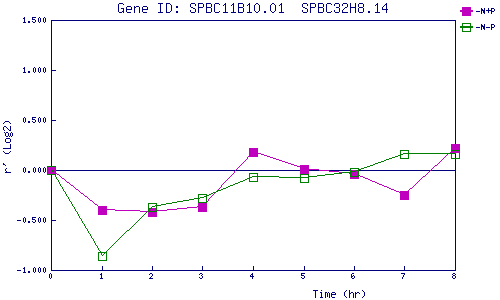
| 0 | 1 | 2 | 3 | 4 | 5 | 6 | 7 | 8 | |
| -N+P | 0.000 | -0.400 | -0.424 | -0.366 | 0.175 | 0.012 | -0.044 | -0.248 | 0.221 |
| -N-P | 0.000 | -0.863 | -0.368 | -0.276 | -0.073 | -0.077 | -0.022 | 0.160 | 0.155 |
|
-N+P: Nitrogen starved in the presence of P-factor -N-P: Nitrogen starved in the absence of P-factor |