pi008
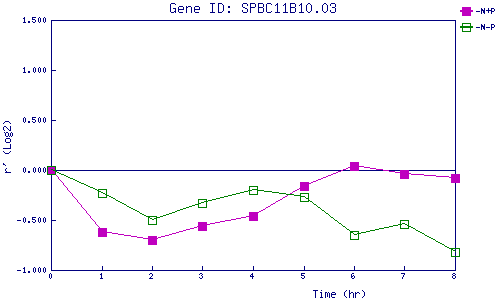
| 0 | 1 | 2 | 3 | 4 | 5 | 6 | 7 | 8 | |
| -N+P | 0.000 | -0.620 | -0.702 | -0.557 | -0.457 | -0.155 | 0.038 | -0.037 | -0.081 |
| -N-P | 0.000 | -0.227 | -0.500 | -0.330 | -0.205 | -0.268 | -0.646 | -0.535 | -0.823 |
|
-N+P: Nitrogen starved in the presence of P-factor -N-P: Nitrogen starved in the absence of P-factor |