pi007
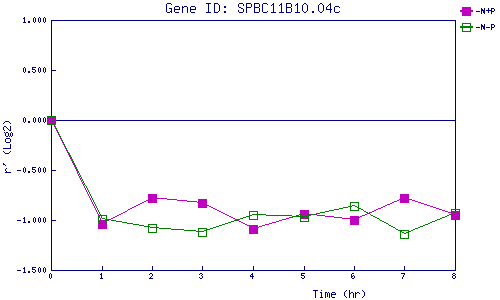
| 0 | 1 | 2 | 3 | 4 | 5 | 6 | 7 | 8 | |
| -N+P | 0.000 | -1.039 | -0.778 | -0.831 | -1.087 | -0.936 | -1.000 | -0.782 | -0.948 |
| -N-P | 0.000 | -0.994 | -1.082 | -1.119 | -0.949 | -0.966 | -0.858 | -1.138 | -0.928 |
|
-N+P: Nitrogen starved in the presence of P-factor -N-P: Nitrogen starved in the absence of P-factor |