pi006 reserved_name_rsp1
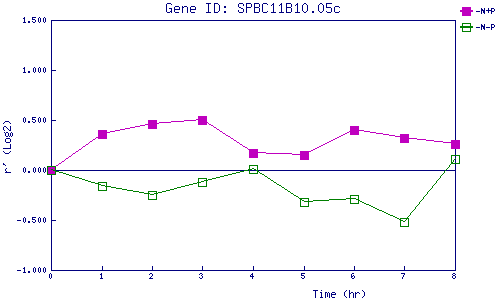
| 0 | 1 | 2 | 3 | 4 | 5 | 6 | 7 | 8 | |
| -N+P | 0.000 | 0.358 | 0.465 | 0.500 | 0.168 | 0.152 | 0.398 | 0.315 | 0.261 |
| -N-P | 0.000 | -0.164 | -0.250 | -0.125 | 0.006 | -0.325 | -0.286 | -0.519 | 0.113 |
|
-N+P: Nitrogen starved in the presence of P-factor -N-P: Nitrogen starved in the absence of P-factor |