cdc2
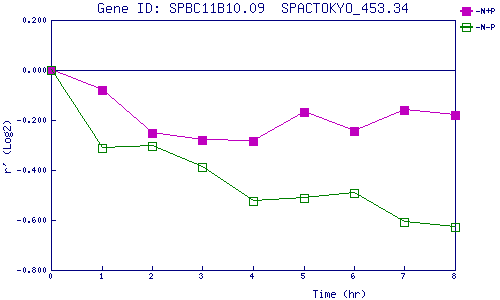
| 0 | 1 | 2 | 3 | 4 | 5 | 6 | 7 | 8 | |
| -N+P | 0.000 | -0.080 | -0.253 | -0.278 | -0.285 | -0.168 | -0.244 | -0.158 | -0.180 |
| -N-P | 0.000 | -0.311 | -0.304 | -0.388 | -0.523 | -0.510 | -0.493 | -0.607 | -0.629 |
|
-N+P: Nitrogen starved in the presence of P-factor -N-P: Nitrogen starved in the absence of P-factor |