pht1 pi001
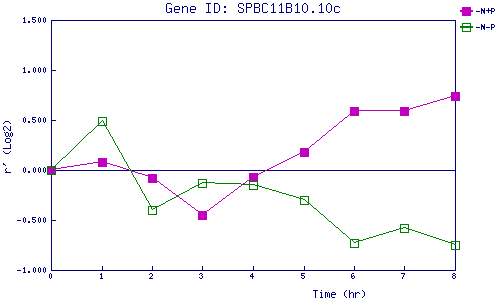
| 0 | 1 | 2 | 3 | 4 | 5 | 6 | 7 | 8 | |
| -N+P | 0.000 | 0.078 | -0.080 | -0.448 | -0.072 | 0.184 | 0.587 | 0.587 | 0.737 |
| -N-P | 0.000 | 0.494 | -0.401 | -0.128 | -0.148 | -0.301 | -0.727 | -0.579 | -0.751 |
|
-N+P: Nitrogen starved in the presence of P-factor -N-P: Nitrogen starved in the absence of P-factor |