imp2
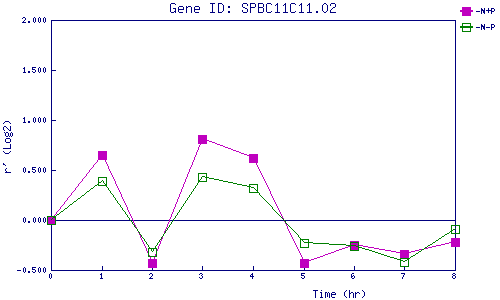
| 0 | 1 | 2 | 3 | 4 | 5 | 6 | 7 | 8 | |
| -N+P | 0.000 | 0.654 | -0.431 | 0.807 | 0.617 | -0.431 | -0.247 | -0.344 | -0.219 |
| -N-P | 0.000 | 0.391 | -0.320 | 0.427 | 0.322 | -0.231 | -0.263 | -0.422 | -0.091 |
|
-N+P: Nitrogen starved in the presence of P-factor -N-P: Nitrogen starved in the absence of P-factor |