alp1
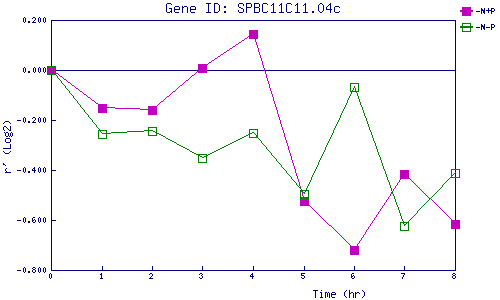
| 0 | 1 | 2 | 3 | 4 | 5 | 6 | 7 | 8 | |
| -N+P | 0.000 | -0.154 | -0.160 | 0.006 | 0.146 | -0.523 | -0.720 | -0.414 | -0.614 |
| -N-P | 0.000 | -0.254 | -0.244 | -0.353 | -0.253 | -0.498 | -0.069 | -0.626 | -0.411 |
|
-N+P: Nitrogen starved in the presence of P-factor -N-P: Nitrogen starved in the absence of P-factor |