| 0 | 1 | 2 | 3 | 4 | 5 | 6 | 7 | 8 | |
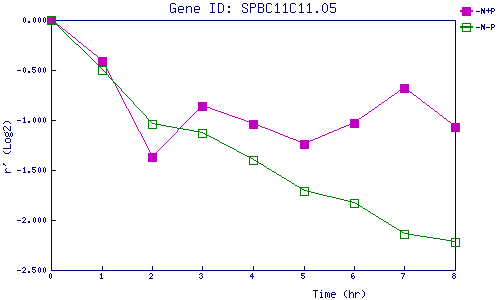
| -N+P | 0.000 | -0.406 | -1.369 | -0.864 | -1.043 | -1.237 | -1.028 | -0.676 | -1.069 |
| -N-P | 0.000 | -0.495 | -1.035 | -1.132 | -1.399 | -1.711 | -1.832 | -2.143 | -2.225 |
|
-N+P: Nitrogen starved in the presence of P-factor -N-P: Nitrogen starved in the absence of P-factor |