rpl18-1 rpl18 rpl1801
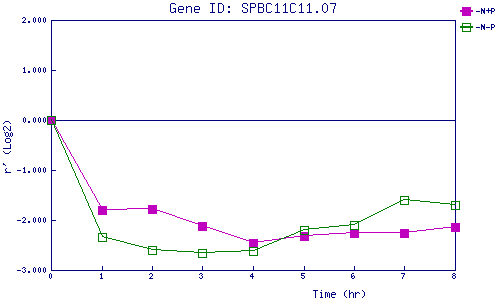
| 0 | 1 | 2 | 3 | 4 | 5 | 6 | 7 | 8 | |
| -N+P | 0.000 | -1.804 | -1.788 | -2.110 | -2.451 | -2.326 | -2.264 | -2.269 | -2.145 |
| -N-P | 0.000 | -2.340 | -2.594 | -2.660 | -2.619 | -2.199 | -2.098 | -1.602 | -1.705 |
|
-N+P: Nitrogen starved in the presence of P-factor -N-P: Nitrogen starved in the absence of P-factor |