srp1
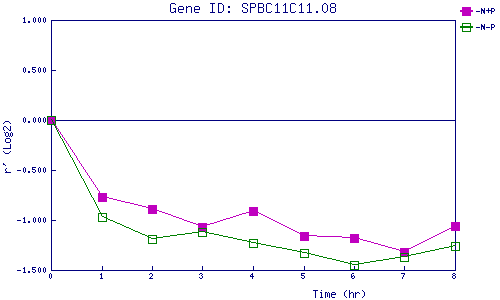
| 0 | 1 | 2 | 3 | 4 | 5 | 6 | 7 | 8 | |
| -N+P | 0.000 | -0.769 | -0.889 | -1.066 | -0.909 | -1.158 | -1.181 | -1.322 | -1.060 |
| -N-P | 0.000 | -0.972 | -1.192 | -1.115 | -1.234 | -1.333 | -1.451 | -1.373 | -1.265 |
|
-N+P: Nitrogen starved in the presence of P-factor -N-P: Nitrogen starved in the absence of P-factor |