rpl5-2 rpl5b rpl502
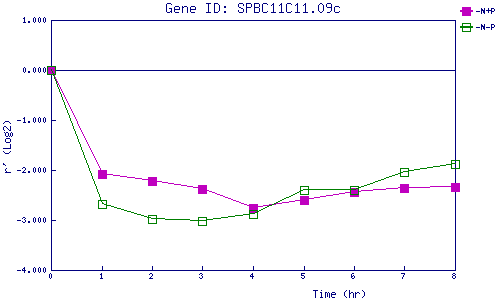
| 0 | 1 | 2 | 3 | 4 | 5 | 6 | 7 | 8 | |
| -N+P | 0.000 | -2.083 | -2.218 | -2.375 | -2.760 | -2.594 | -2.446 | -2.350 | -2.344 |
| -N-P | 0.000 | -2.681 | -2.981 | -3.020 | -2.873 | -2.407 | -2.397 | -2.034 | -1.873 |
|
-N+P: Nitrogen starved in the presence of P-factor -N-P: Nitrogen starved in the absence of P-factor |