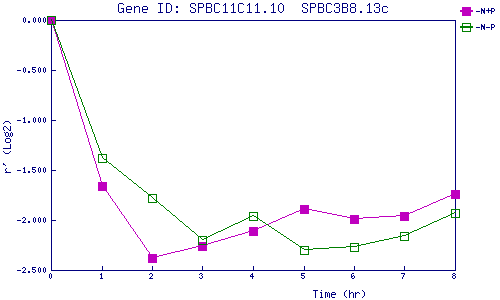
| 0 | 1 | 2 | 3 | 4 | 5 | 6 | 7 | 8 | |
| -N+P | 0.000 | -1.663 | -2.379 | -2.257 | -2.108 | -1.887 | -1.992 | -1.956 | -1.739 |
| -N-P | 0.000 | -1.385 | -1.782 | -2.201 | -1.955 | -2.305 | -2.268 | -2.155 | -1.930 |
|
-N+P: Nitrogen starved in the presence of P-factor -N-P: Nitrogen starved in the absence of P-factor |