end3
| 0 | 1 | 2 | 3 | 4 | 5 | 6 | 7 | 8 | |
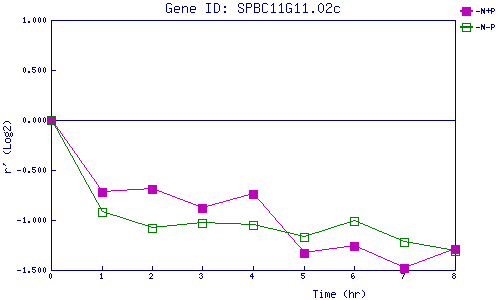
| -N+P | 0.000 | -0.715 | -0.688 | -0.876 | -0.744 | -1.332 | -1.260 | -1.477 | -1.294 |
| -N-P | 0.000 | -0.925 | -1.078 | -1.028 | -1.052 | -1.174 | -1.014 | -1.220 | -1.308 |
|
-N+P: Nitrogen starved in the presence of P-factor -N-P: Nitrogen starved in the absence of P-factor |
