| 0 | 1 | 2 | 3 | 4 | 5 | 6 | 7 | 8 | |
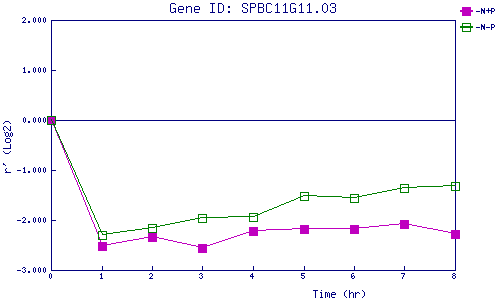
| -N+P | 0.000 | -2.530 | -2.347 | -2.550 | -2.211 | -2.185 | -2.185 | -2.077 | -2.284 |
| -N-P | 0.000 | -2.298 | -2.151 | -1.956 | -1.934 | -1.524 | -1.559 | -1.353 | -1.321 |
|
-N+P: Nitrogen starved in the presence of P-factor -N-P: Nitrogen starved in the absence of P-factor |