trs20
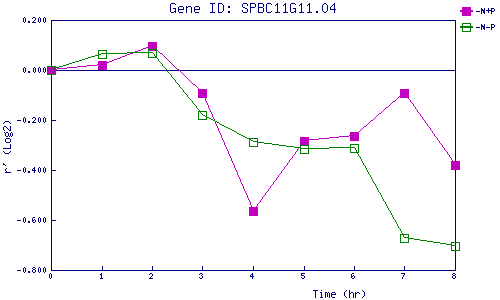
| 0 | 1 | 2 | 3 | 4 | 5 | 6 | 7 | 8 | |
| -N+P | 0.000 | 0.019 | 0.098 | -0.092 | -0.564 | -0.285 | -0.266 | -0.091 | -0.381 |
| -N-P | 0.000 | 0.064 | 0.068 | -0.179 | -0.289 | -0.316 | -0.311 | -0.670 | -0.706 |
|
-N+P: Nitrogen starved in the presence of P-factor -N-P: Nitrogen starved in the absence of P-factor |