| 0 | 1 | 2 | 3 | 4 | 5 | 6 | 7 | 8 | |
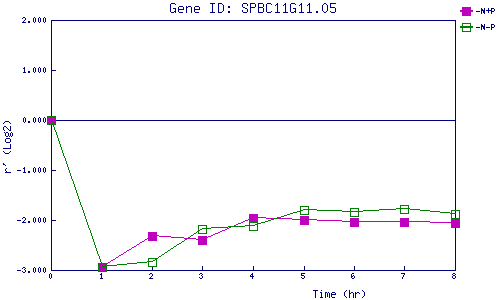
| -N+P | 0.000 | -2.935 | -2.321 | -2.392 | -1.960 | -2.005 | -2.042 | -2.041 | -2.058 |
| -N-P | 0.000 | -2.935 | -2.833 | -2.179 | -2.115 | -1.799 | -1.849 | -1.786 | -1.881 |
|
-N+P: Nitrogen starved in the presence of P-factor -N-P: Nitrogen starved in the absence of P-factor |