sme1
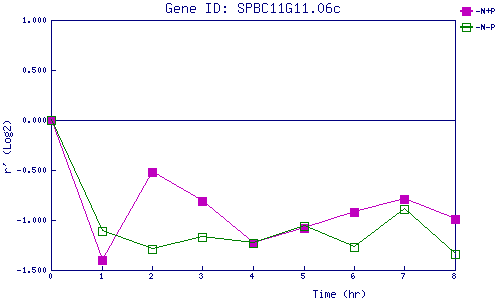
| 0 | 1 | 2 | 3 | 4 | 5 | 6 | 7 | 8 | |
| -N+P | 0.000 | -1.404 | -0.517 | -0.813 | -1.229 | -1.077 | -0.921 | -0.786 | -0.990 |
| -N-P | 0.000 | -1.114 | -1.290 | -1.172 | -1.234 | -1.063 | -1.267 | -0.888 | -1.345 |
|
-N+P: Nitrogen starved in the presence of P-factor -N-P: Nitrogen starved in the absence of P-factor |