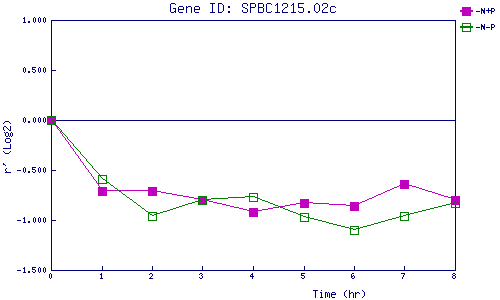
| 0 | 1 | 2 | 3 | 4 | 5 | 6 | 7 | 8 | |
| -N+P | 0.000 | -0.710 | -0.707 | -0.802 | -0.924 | -0.834 | -0.862 | -0.640 | -0.801 |
| -N-P | 0.000 | -0.587 | -0.962 | -0.796 | -0.772 | -0.971 | -1.100 | -0.956 | -0.832 |
|
-N+P: Nitrogen starved in the presence of P-factor -N-P: Nitrogen starved in the absence of P-factor |