stt3
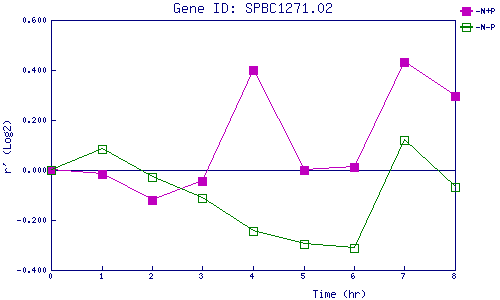
| 0 | 1 | 2 | 3 | 4 | 5 | 6 | 7 | 8 | |
| -N+P | 0.000 | -0.018 | -0.120 | -0.043 | 0.399 | -0.001 | 0.011 | 0.430 | 0.295 |
| -N-P | 0.000 | 0.084 | -0.028 | -0.113 | -0.243 | -0.295 | -0.312 | 0.121 | -0.068 |
|
-N+P: Nitrogen starved in the presence of P-factor -N-P: Nitrogen starved in the absence of P-factor |