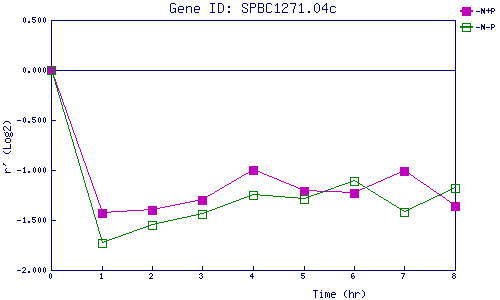
| 0 | 1 | 2 | 3 | 4 | 5 | 6 | 7 | 8 | |
| -N+P | 0.000 | -1.426 | -1.402 | -1.295 | -1.004 | -1.213 | -1.231 | -1.007 | -1.357 |
| -N-P | 0.000 | -1.730 | -1.549 | -1.435 | -1.246 | -1.294 | -1.108 | -1.424 | -1.180 |
|
-N+P: Nitrogen starved in the presence of P-factor -N-P: Nitrogen starved in the absence of P-factor |