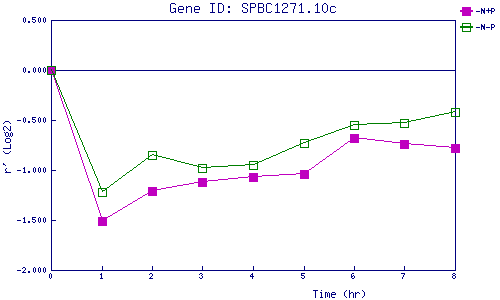
| 0 | 1 | 2 | 3 | 4 | 5 | 6 | 7 | 8 | |
| -N+P | 0.000 | -1.506 | -1.209 | -1.124 | -1.066 | -1.038 | -0.675 | -0.740 | -0.775 |
| -N-P | 0.000 | -1.221 | -0.854 | -0.985 | -0.951 | -0.733 | -0.554 | -0.531 | -0.421 |
|
-N+P: Nitrogen starved in the presence of P-factor -N-P: Nitrogen starved in the absence of P-factor |