kes1
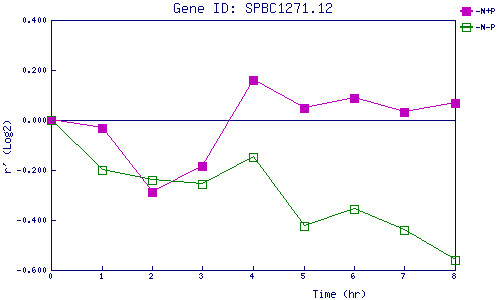
| 0 | 1 | 2 | 3 | 4 | 5 | 6 | 7 | 8 | |
| -N+P | 0.000 | -0.030 | -0.289 | -0.182 | 0.159 | 0.047 | 0.089 | 0.033 | 0.068 |
| -N-P | 0.000 | -0.201 | -0.240 | -0.257 | -0.147 | -0.426 | -0.356 | -0.441 | -0.562 |
|
-N+P: Nitrogen starved in the presence of P-factor -N-P: Nitrogen starved in the absence of P-factor |