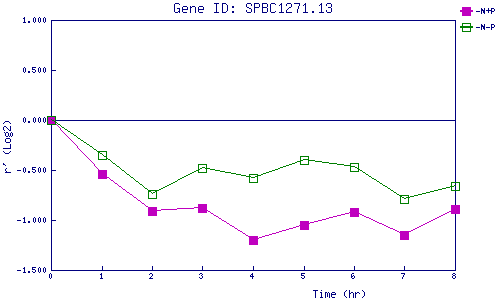
| 0 | 1 | 2 | 3 | 4 | 5 | 6 | 7 | 8 | |
| -N+P | 0.000 | -0.538 | -0.907 | -0.875 | -1.196 | -1.048 | -0.918 | -1.150 | -0.888 |
| -N-P | 0.000 | -0.348 | -0.743 | -0.483 | -0.582 | -0.401 | -0.468 | -0.791 | -0.657 |
|
-N+P: Nitrogen starved in the presence of P-factor -N-P: Nitrogen starved in the absence of P-factor |