reserved_name_cfh3
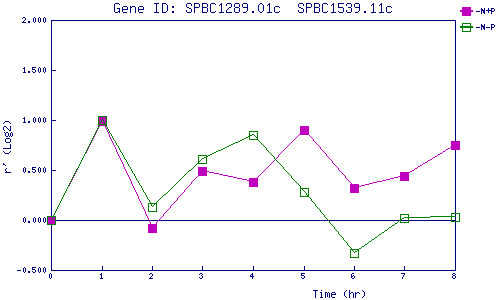
| 0 | 1 | 2 | 3 | 4 | 5 | 6 | 7 | 8 | |
| -N+P | 0.000 | 0.988 | -0.075 | 0.490 | 0.376 | 0.895 | 0.319 | 0.436 | 0.751 |
| -N-P | 0.000 | 0.997 | 0.126 | 0.607 | 0.853 | 0.285 | -0.332 | 0.023 | 0.033 |
|
-N+P: Nitrogen starved in the presence of P-factor -N-P: Nitrogen starved in the absence of P-factor |