spi1
| 0 | 1 | 2 | 3 | 4 | 5 | 6 | 7 | 8 | |
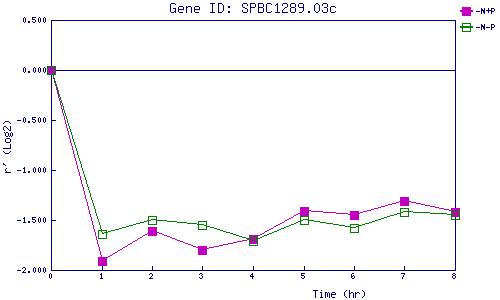
| -N+P | 0.000 | -1.913 | -1.608 | -1.795 | -1.686 | -1.407 | -1.447 | -1.313 | -1.419 |
| -N-P | 0.000 | -1.642 | -1.504 | -1.549 | -1.715 | -1.502 | -1.584 | -1.421 | -1.450 |
|
-N+P: Nitrogen starved in the presence of P-factor -N-P: Nitrogen starved in the absence of P-factor |
