rpc40 rpa42
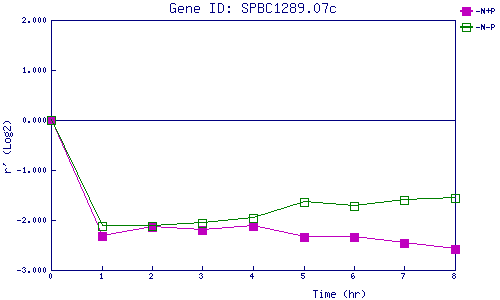
| 0 | 1 | 2 | 3 | 4 | 5 | 6 | 7 | 8 | |
| -N+P | 0.000 | -2.330 | -2.138 | -2.204 | -2.111 | -2.348 | -2.346 | -2.461 | -2.572 |
| -N-P | 0.000 | -2.125 | -2.122 | -2.059 | -1.955 | -1.647 | -1.721 | -1.610 | -1.565 |
|
-N+P: Nitrogen starved in the presence of P-factor -N-P: Nitrogen starved in the absence of P-factor |