| 0 | 1 | 2 | 3 | 4 | 5 | 6 | 7 | 8 | |
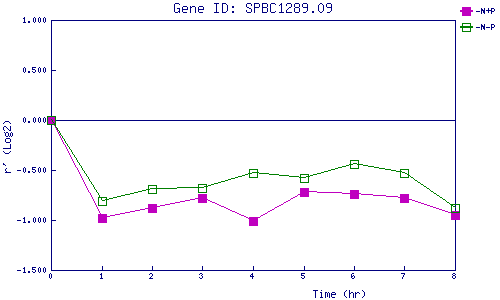
| -N+P | 0.000 | -0.980 | -0.880 | -0.783 | -1.009 | -0.724 | -0.739 | -0.778 | -0.952 |
| -N-P | 0.000 | -0.811 | -0.691 | -0.677 | -0.528 | -0.577 | -0.441 | -0.526 | -0.878 |
|
-N+P: Nitrogen starved in the presence of P-factor -N-P: Nitrogen starved in the absence of P-factor |