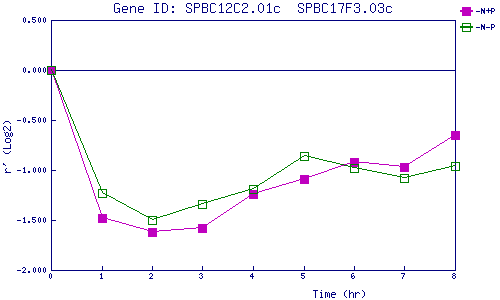
| 0 | 1 | 2 | 3 | 4 | 5 | 6 | 7 | 8 | |
| -N+P | 0.000 | -1.476 | -1.622 | -1.585 | -1.243 | -1.093 | -0.918 | -0.969 | -0.648 |
| -N-P | 0.000 | -1.234 | -1.502 | -1.336 | -1.186 | -0.864 | -0.980 | -1.085 | -0.960 |
|
-N+P: Nitrogen starved in the presence of P-factor -N-P: Nitrogen starved in the absence of P-factor |