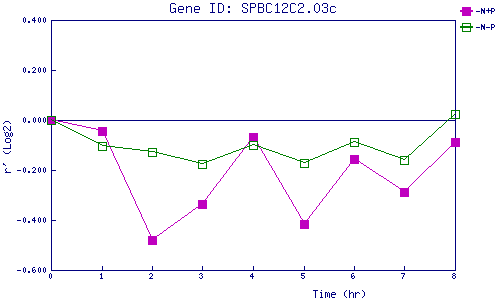
| 0 | 1 | 2 | 3 | 4 | 5 | 6 | 7 | 8 | |
| -N+P | 0.000 | -0.044 | -0.479 | -0.337 | -0.067 | -0.415 | -0.155 | -0.288 | -0.086 |
| -N-P | 0.000 | -0.105 | -0.127 | -0.178 | -0.100 | -0.171 | -0.089 | -0.159 | 0.024 |
|
-N+P: Nitrogen starved in the presence of P-factor -N-P: Nitrogen starved in the absence of P-factor |