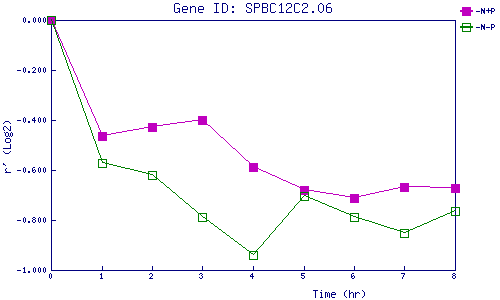
| 0 | 1 | 2 | 3 | 4 | 5 | 6 | 7 | 8 | |
| -N+P | 0.000 | -0.466 | -0.427 | -0.400 | -0.587 | -0.678 | -0.713 | -0.669 | -0.671 |
| -N-P | 0.000 | -0.572 | -0.619 | -0.788 | -0.939 | -0.706 | -0.789 | -0.851 | -0.763 |
|
-N+P: Nitrogen starved in the presence of P-factor -N-P: Nitrogen starved in the absence of P-factor |