| 0 | 1 | 2 | 3 | 4 | 5 | 6 | 7 | 8 | |
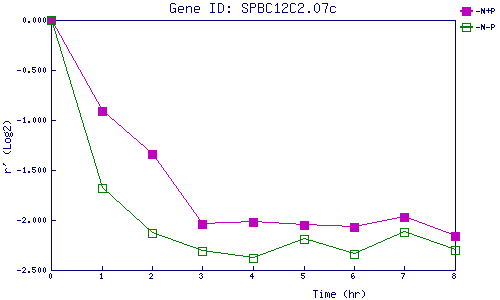
| -N+P | 0.000 | -0.911 | -1.335 | -2.036 | -2.017 | -2.051 | -2.066 | -1.969 | -2.155 |
| -N-P | 0.000 | -1.683 | -2.133 | -2.306 | -2.377 | -2.188 | -2.337 | -2.123 | -2.301 |
|
-N+P: Nitrogen starved in the presence of P-factor -N-P: Nitrogen starved in the absence of P-factor |