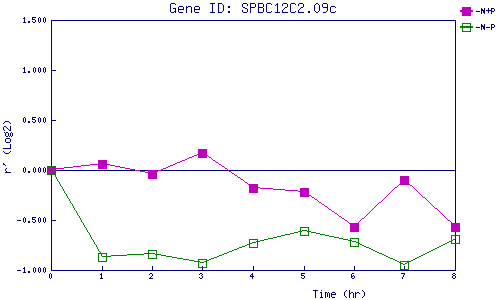
| 0 | 1 | 2 | 3 | 4 | 5 | 6 | 7 | 8 | |
| -N+P | 0.000 | 0.058 | -0.037 | 0.168 | -0.179 | -0.225 | -0.567 | -0.104 | -0.571 |
| -N-P | 0.000 | -0.867 | -0.840 | -0.929 | -0.732 | -0.608 | -0.715 | -0.946 | -0.694 |
|
-N+P: Nitrogen starved in the presence of P-factor -N-P: Nitrogen starved in the absence of P-factor |