sad1
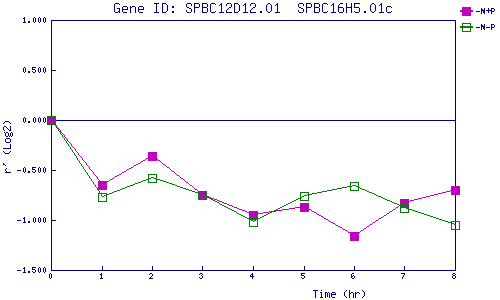
| 0 | 1 | 2 | 3 | 4 | 5 | 6 | 7 | 8 | |
| -N+P | 0.000 | -0.649 | -0.358 | -0.753 | -0.953 | -0.867 | -1.162 | -0.834 | -0.696 |
| -N-P | 0.000 | -0.772 | -0.582 | -0.752 | -1.017 | -0.762 | -0.661 | -0.881 | -1.048 |
|
-N+P: Nitrogen starved in the presence of P-factor -N-P: Nitrogen starved in the absence of P-factor |