cct1
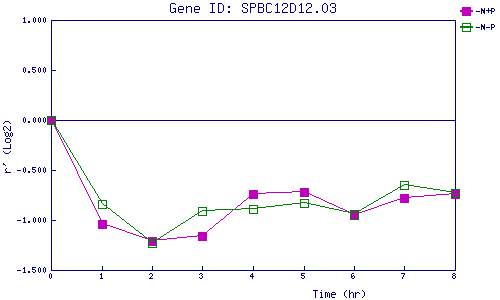
| 0 | 1 | 2 | 3 | 4 | 5 | 6 | 7 | 8 | |
| -N+P | 0.000 | -1.043 | -1.210 | -1.155 | -0.743 | -0.716 | -0.954 | -0.775 | -0.742 |
| -N-P | 0.000 | -0.836 | -1.231 | -0.909 | -0.890 | -0.829 | -0.936 | -0.646 | -0.729 |
|
-N+P: Nitrogen starved in the presence of P-factor -N-P: Nitrogen starved in the absence of P-factor |