pck2 sts6 pkc1
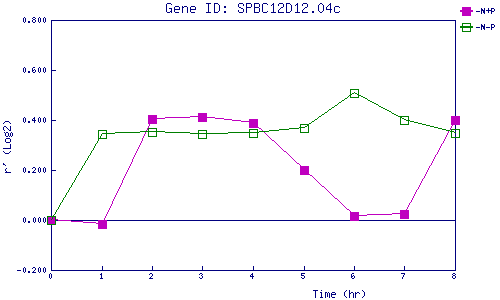
| 0 | 1 | 2 | 3 | 4 | 5 | 6 | 7 | 8 | |
| -N+P | 0.000 | -0.015 | 0.404 | 0.413 | 0.389 | 0.201 | 0.015 | 0.023 | 0.401 |
| -N-P | 0.000 | 0.346 | 0.351 | 0.344 | 0.347 | 0.370 | 0.508 | 0.400 | 0.347 |
|
-N+P: Nitrogen starved in the presence of P-factor -N-P: Nitrogen starved in the absence of P-factor |