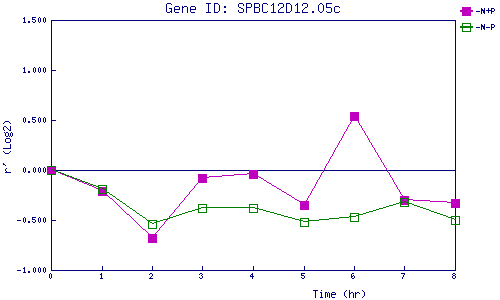
| 0 | 1 | 2 | 3 | 4 | 5 | 6 | 7 | 8 | |
| -N+P | 0.000 | -0.214 | -0.680 | -0.084 | -0.038 | -0.346 | 0.537 | -0.305 | -0.326 |
| -N-P | 0.000 | -0.189 | -0.536 | -0.381 | -0.385 | -0.520 | -0.470 | -0.324 | -0.503 |
|
-N+P: Nitrogen starved in the presence of P-factor -N-P: Nitrogen starved in the absence of P-factor |