srb11
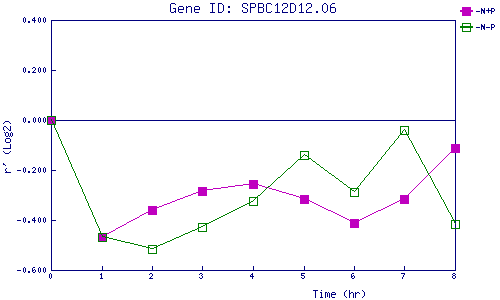
| 0 | 1 | 2 | 3 | 4 | 5 | 6 | 7 | 8 | |
| -N+P | 0.000 | -0.469 | -0.359 | -0.284 | -0.255 | -0.315 | -0.412 | -0.316 | -0.114 |
| -N-P | 0.000 | -0.467 | -0.515 | -0.427 | -0.325 | -0.141 | -0.290 | -0.039 | -0.416 |
|
-N+P: Nitrogen starved in the presence of P-factor -N-P: Nitrogen starved in the absence of P-factor |