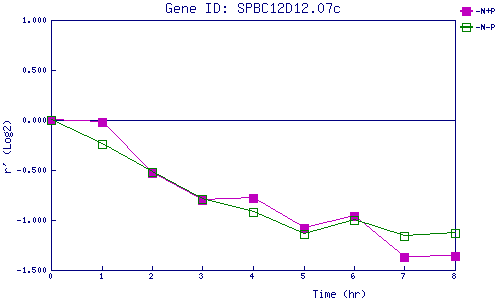
| 0 | 1 | 2 | 3 | 4 | 5 | 6 | 7 | 8 | |
| -N+P | 0.000 | -0.017 | -0.534 | -0.805 | -0.775 | -1.085 | -0.957 | -1.369 | -1.355 |
| -N-P | 0.000 | -0.242 | -0.520 | -0.791 | -0.918 | -1.140 | -0.997 | -1.159 | -1.128 |
|
-N+P: Nitrogen starved in the presence of P-factor -N-P: Nitrogen starved in the absence of P-factor |