fkbp39
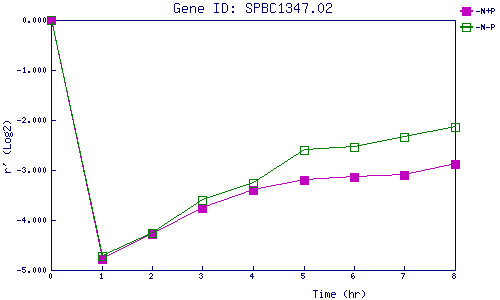
| 0 | 1 | 2 | 3 | 4 | 5 | 6 | 7 | 8 | |
| -N+P | 0.000 | -4.782 | -4.275 | -3.769 | -3.397 | -3.207 | -3.147 | -3.097 | -2.872 |
| -N-P | 0.000 | -4.712 | -4.254 | -3.604 | -3.264 | -2.607 | -2.537 | -2.333 | -2.139 |
|
-N+P: Nitrogen starved in the presence of P-factor -N-P: Nitrogen starved in the absence of P-factor |