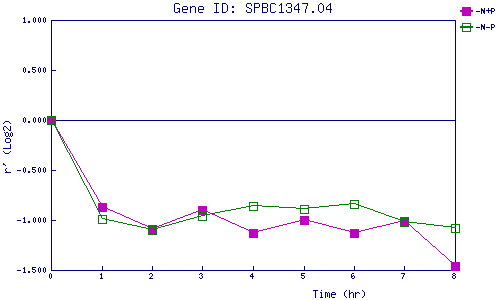
| 0 | 1 | 2 | 3 | 4 | 5 | 6 | 7 | 8 | |
| -N+P | 0.000 | -0.873 | -1.094 | -0.901 | -1.130 | -1.004 | -1.128 | -1.015 | -1.455 |
| -N-P | 0.000 | -0.993 | -1.098 | -0.965 | -0.864 | -0.891 | -0.840 | -1.016 | -1.078 |
|
-N+P: Nitrogen starved in the presence of P-factor -N-P: Nitrogen starved in the absence of P-factor |