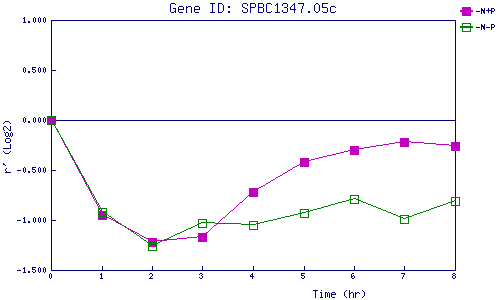
| 0 | 1 | 2 | 3 | 4 | 5 | 6 | 7 | 8 | |
| -N+P | 0.000 | -0.947 | -1.219 | -1.169 | -0.723 | -0.421 | -0.299 | -0.219 | -0.255 |
| -N-P | 0.000 | -0.920 | -1.256 | -1.033 | -1.047 | -0.929 | -0.793 | -0.986 | -0.813 |
|
-N+P: Nitrogen starved in the presence of P-factor -N-P: Nitrogen starved in the absence of P-factor |