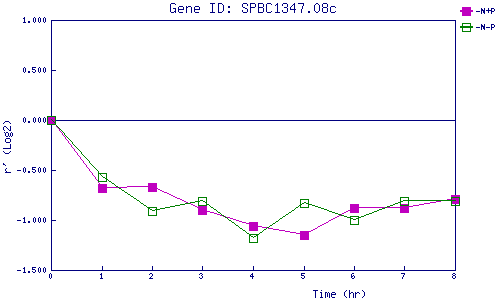
| 0 | 1 | 2 | 3 | 4 | 5 | 6 | 7 | 8 | |
| -N+P | 0.000 | -0.684 | -0.668 | -0.902 | -1.064 | -1.154 | -0.875 | -0.876 | -0.790 |
| -N-P | 0.000 | -0.568 | -0.911 | -0.810 | -1.185 | -0.831 | -0.996 | -0.810 | -0.811 |
|
-N+P: Nitrogen starved in the presence of P-factor -N-P: Nitrogen starved in the absence of P-factor |